Enzyme Assays
One of the main challenges in cellulase enzymology is the scarcity of assays that can characterize the activity on insoluble substrates; particularly real-time assays. RESAB uses a number of classical approaches including colorimetric methods to characterize the concentration of reducing ends and high-pressure chromatography to measure the product profile at given time-points. In addition to this, the group has implemented a number of other assay types; each with different advantages and limitations. The assay technologies developed in-house include:
Calorimetry
The basic idea is to follow the rate of the enzymatic reaction through the heat it produces. Specifically isothermal calorimeters quantify the flow of heat (in units of J/s or W) that has to be supplied or removed to keep the reaction vessel at a constant temperature. As each hydrolytic event releases a characteristic heat (typically around 2.5 kJ/mol for insoluble cellulose), the measured heat flow will be proportional to the rate of the reaction. This approach has certain advantages. Hence, it provides real-time data and is readily applicable to opaque and multi-phase sample including samples with high solid contents. Another benefit of the approach is that is detects the rate of hydrolysis (not the concentration of product), and this provides better resolution for changes occurring through the hydrolysis and enables direct measurement of product inhibition effects. Some of the drawbacks of calorimetry include limited sensitivity and resolution in time (changes occurring faster that ~10-90 sec. – depending on instrument type - are partially smeared)
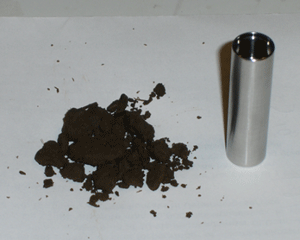
Biomass with a dry-weight content of about 30% has an appearance like moist soil. Enzymatic activity against this substrate can be monitored directly e.g. in 4 ml calorimetric steel cells as the one shown on the picture.
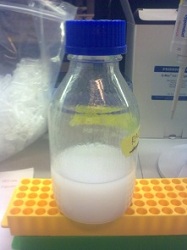
Aqueous suspensions of pure amorphous cellulose.
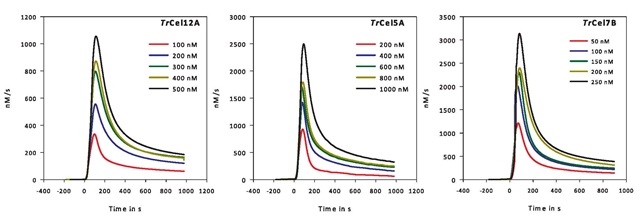
Examples of calorimetric data for mono-component cellulases hydrolyzing pure, amorphous cellulose. The hydrolytic rates (in nM/s) for three endo-acting enzymes Cel12A, Cel5A and Cel7B are plotted against time for different enzyme concentrations. For more information see The Journal of Biological Chemistry (2012) vol 287. p. 1252.
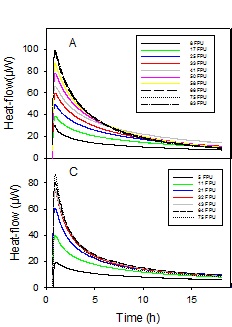
Hydrolysis of complex biomass monitored by calorimetry. The substrate is leaves and stalks from the maize plant (so-called corn stover) and the enzyme, added at time=0, is a cocktail of cellulases from the fungus Hypocrea. The heat signal increases with increasing enzyme load.
Amperometric Biosensors
This type of assay has been developed in collaboration with Prof. Hirosuke Tatsumi, Shinshu University, Japan. Basically, the sensors detect the concentration of product (e.g. glucose or cellobiose) in real time. Our current sensors can detect concentration differences down to about 20 nM cellobiose with a time resolution of 1-2 sec, and this is sufficient to elucidate the transient kinetic behavior of cellulases – i.e. the kinetics before steady state is established.
The key principle is illustrated in the figure. Soluble saccharides produced by the hydrolytic reaction are oxidized by an enzyme, which is immobilized on the tip of the electrode. Electrons from this redox-process are captured by the electrode and quantified in the external circuitry. Hence, the electrode generates a electric current which is proportional to the concentration of the reaction product. As only a miniscule fraction of the product is oxidized at the sensor tip, the detection leaves the system practically unperturbed. A detailed description of the sensors is given in Bioengineering and Biotechnology (in press) DOI: 10.1002/bit.24593.
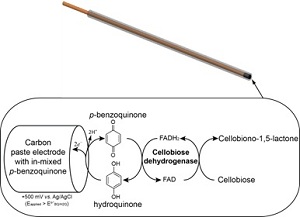
Diagram of the measuring principle for amperometric biosensors. The enzyme cellobiose dehydrogenase (CDH) is immobilized on carbon paste at the tip of the electrode. The carbon paste also contains benzoquinone which acts as a mediator for shuttling electrons from the oxidation process into the electrode.
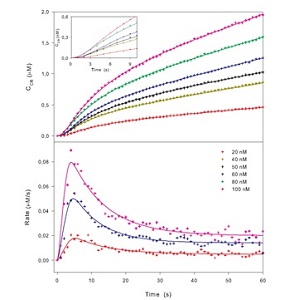
Examples of enzyme hydrolysis measured by amperometric biosensors. The concentration of product (upper panel) and the rate of hydrolysis (lower panel) are plotted as a function of time. The points reflect the experimental data and the lines are model fits.
It appears that this enzyme, the exo-acting Cel7A, shows a conspicuous maximum in rate (a so-called burst phase) before the system approaches steady state after about 30 sec. See Journal of Biological Chemistry (2012) Vol. 287 p. 18451 for details.